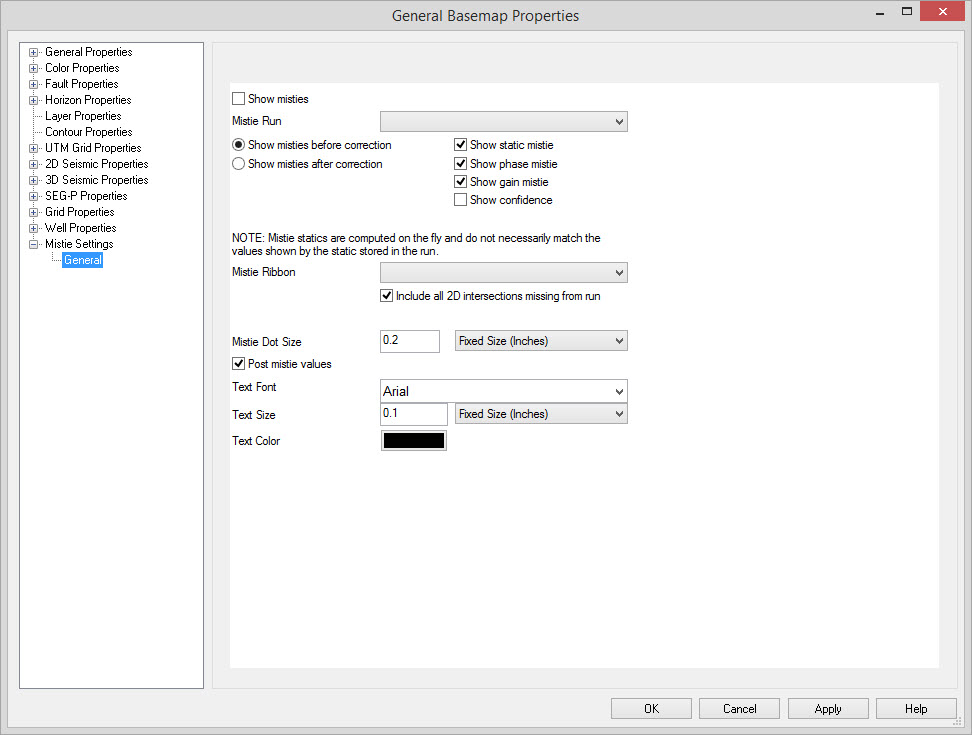
Mistie Settings: General
Mistie dots can be used to check the results generated from a run
created in the Automatic
Mistie Analysis. To view these results, first create a run and then
use the mistie settings to display the mistie dots showing static,
phase and gain difference at intersections. You can also compare static
busts at intersections (determined by a horizon pick).
Automatic Mistie Ribbons
Mistie Run: Select
the run to display
mistie circles for. For more information about mistie runs see the Automatic Mistie
Analysis dialog. Dots should appear at all 2D intersections
included in the run as well as any jump
tie intersections that were added to the run.
Show misties before correction/Show misties after correction: Select which set of data you would like to display, either the initial estimates or the results calculated.
Show static mistie: Toggle on to include static mistie errors in the circle. The values are the estimated shift in milliseconds.
Show phase mistie: Toggle on to include phase mistie errors in the circle. The values are the phase rotation difference in degrees.
Show gain mistie: Toggle on to include gain mistie errors in the circle. The value is a scalar multiplier to help match the RMS between lines.
Show confidence: Toggle on to include the confidence value in the circle. The confidence in the result: ranges between 0 - 100 with 100 being the most confident.
Note: Using any combination of the above four parameters, a circle will be drawn, evenly divided between the selected options. The color used will depend on the colorbar selected, and all parameters share the same colorbar.
Horizon Mistie Ribbons
Mistie Ribbon: Use
this option to create a
visual mistie dot map using a horizon. The static difference between
horizon picks at all intersections is calculated on the fly and then
displayed in the dots.
Mistie Ribbon Display Parameters
Show Misties:
Toggle on to turn on mistie
ribbons on the Basemap.
Mistie Dot Size: Specified the size of the mistie dots. Read fonts for details on how fixed vs variable sizing works.
Post mistie values: Indicates that the actual error values should be posted next to the colored portion of the dot. Abbreviations used are: S = Static, P = Phase, G = Gain, C = Confidence.
Text Font, Text Size, Text Color: Dictates the appearance of posted mistie values.
Note: Fixed sized objects will remain the same regardless of the map scale. Variable sized objects will change size with the map scale.
Also See
— MORE INFORMATION

|
Copyright © 2020 | SeisWare International Inc. | All rights reserved |